Though accustomed to evaluating ML models with respect to performance statistics like accuracy, real-world deployment scenarios must weigh multiple models performing comparably. Deciding which to launch in A/B experiment can be challenging when the offline metrics are just a proxy for online metrics core to business decisions. Experiment time is precious and for large experiments on foundational models, the tolerance for error is limited hence it is critical to base experiment launch decisions on a collection of diverse metrics.
In computer vision, attention mechanisms feature the ability to explain model predictions by visualizing attention maps. In this post, we highlight a similar technique which generalizes to other CNN based architectures, called GradCAM.
Researchers at the Georgia Institute of Technology introduced GradCAM to help explain CNN model predictions. CAM stands for Class Activation Mapping, hinting at the mechanism of discriminating regions in the receptive field based on data labels.
By analyzing the gradient flow for a sample, CNN feature maps give rise to heat maps after a ReLU activation filters pixels not correlated with correctly predicting the label. Keras docs reference a simple implementation.
When making decisions about complex models, it helps to have a view into which factors influence model outcomes. As the researchers point out, model interpretability is important for building ML systems we can trust. Pairing GradCAM with mechanical turks provides a powerful comparison in how humans and algorithms reason about labeling example instances.
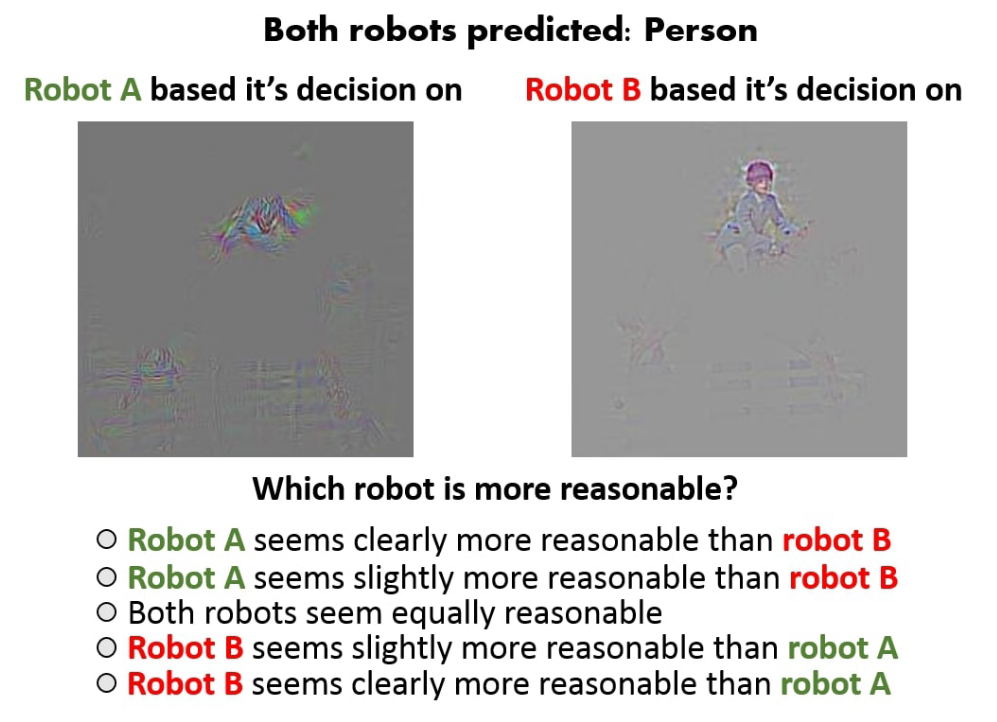
Additionally, GradCAM activations can be quantitatively compared to human attention via “the pointing game” referenced here
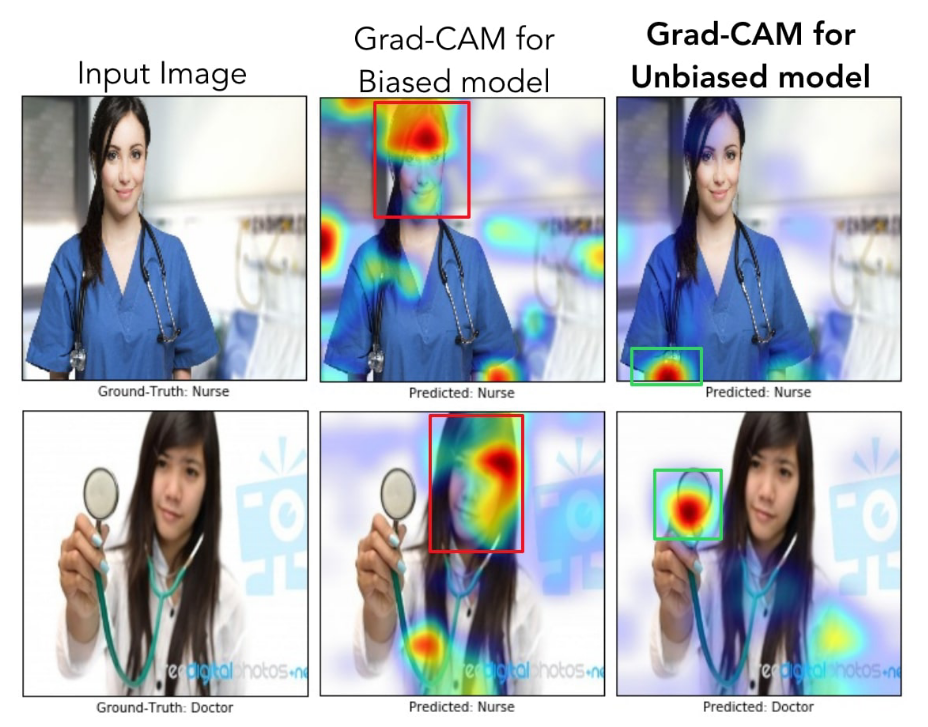
The researchers also show how GradCAM can be applied to identify bias in model performance to improve model fairness. In their proof of concept, they use these activation mappings to show models making decisions based on spurious reasoning due to bias in training samples.
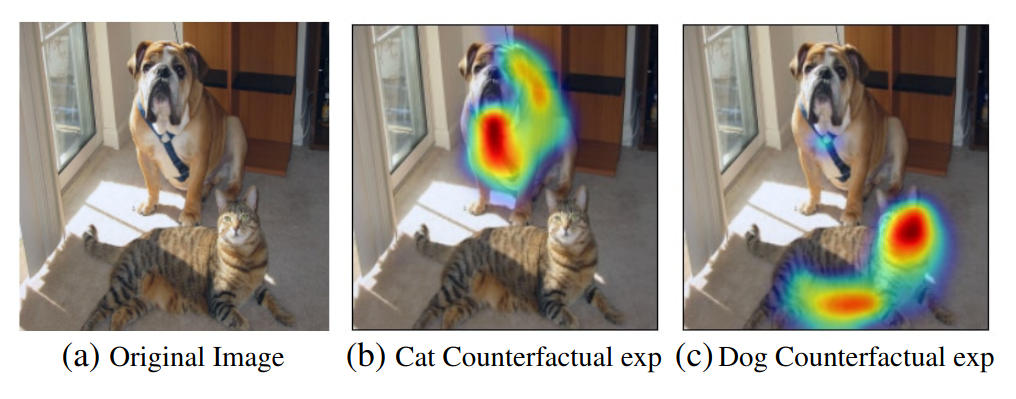
These visualization techniques can even help develop counterfactual explanations for a sample, whereby we visualize regions most likely to change a network’s decision.
Seeking additional insights into our genre classifiers, we visualize some activation maps for theatrical posters.

Superimposing the heatmaps over the original images, GradCAM highlights regions of each sample important for genre prediction. While these heat maps appear to highlight relevant semantic content for predicting genres like sports, we are mindful of the potential bias in allowing convnets to focus on text.
Depending upon the context, it could make sense to provide the model with this information, perhaps even more directly. Still in another contexts, a model may overfit to information like this and lack robustness to variance in a title’s language. In this case, we could consider scene text removal similar to this demo.